
Basic MySQL Optimizer Tracing
Have you investigated a query that is performing poorly?
If so, you likely are familiar with the concept of EXPLAINing the query to see how the database is choosing to obtain the results.
EXPLAIN can help you to see whether the query does a full table scan, or a slightly more optimal index scan.
But EXPLAIN doesn’t really tell you why MySQL is doing this.
And a Data Guardian will need to be able to understand this why.
So let’s take a look under the hood at the MySQL optimizer.
What is MySQL’s optimizer
A typical application will make many calls to the database to gather information for the end user.
These requests are called queries.
It is unlikely that you want to make your users wait more than a few milliseconds to load that data.
So, query performance is critical for any serious application.
A database like MySQL will likely have multiple ways to retrieve the results of a query.
Simple queries can either be a full table scan, or utilize an index.
There are different types of scans across the rows that can be used which depends on the filters in the WHERE clause.
The number of ways to get the results gets even more complicated if the query contains subqueries or joins.
To keep query performance fast, MySQL has to make a quick decision of which path to take.
And this is what the optimizer does.
In really simple terms, it estimates a cost for each potential path to get the query results based on how the query is constructed.
If you are interested, the MySQL documentation shows the different primary optimizations, as well as other optimizations.
It’s a bit of light reading that requires at least 2 cups of coffee!
Why trace the optimizer
But ok, great.
The optimizer determines the cost to retrieve results. So what?
Well, if you have ever tried investigating the performance of a query, I assume you have looked at the EXPLAIN output.
This has told you how MySQL has resolved the query.
But have you ever looked at a query that suddenly started performing poorly, and been left wondering why?
Some times, it is because the optimizer chose a different path.
It’s also common that the path can change based on the values of the query. Because the values change the selectivity.
Imagine if you have a table that tracks all of your user activity.
It’s early stage of your application, so you have one user that contains 90% of your activity.
When selecting for that user, MySQL could decide it costs less to do a full table scan than using that nice user_id index you have on the table.
Unfortunately, EXPLAIN won’t give you the why, only the how.
Luckily, you have the ability to trace the MySQL optimizer to find out why.
Tracing MySQL’s optimizer
To trace the MySQL optimizer, you have to turn it on for your session.
This is achieved by setting optimizer_trace="enabled=on".

Be warned though, the output can be long.
Then you run the query you want to trace.
You can retrieve the results of the trace from the INFORMATION_SCHEMA.OPTIMIZER_TRACE table.
Tracing a query is session specific.
So once you have run your query and retrieved the results, you can turn off the trace feature.
This helps avoid trace penalties while you continue investigating the query.
As I mentioned, the output is very long. It contains information for each path the optimizer could choose to retrieve results.
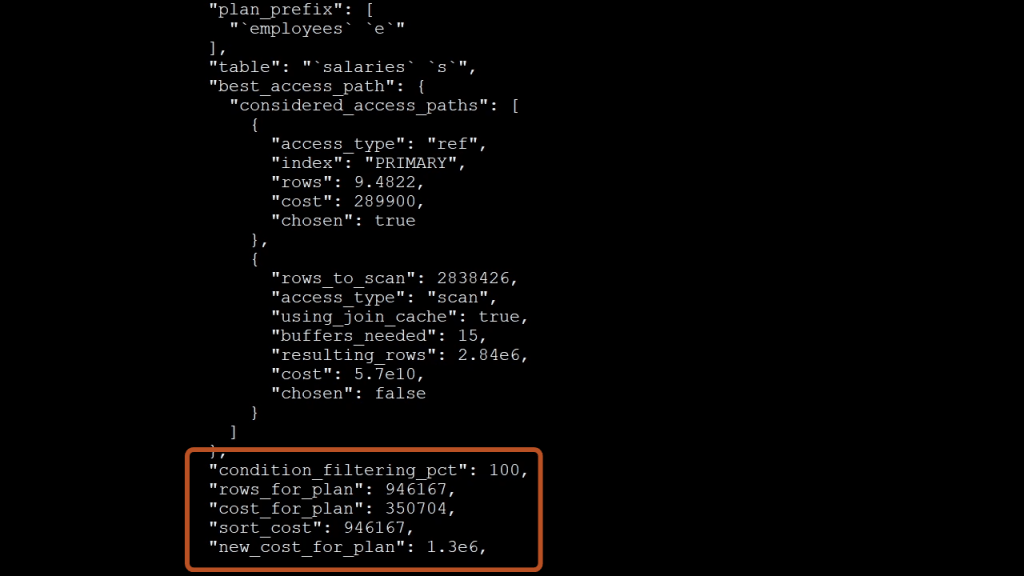
What you are typically looking for is the cost associated with each option.
In the optimizer, the lower cost wins!
Conclusion
Query performance is critical to your application performance.
It is the job of the MySQL optimizer to quickly choose the best strategy to retrieve results of queries.
As a Data Guardian, you will need to be able to dig into the details of why MySQL chooses a particular path.
Luckily, MySQL provides you a way to trace the optimizer so that you can find out why.
Now that you know how to do trace the MySQL optimizer, I wish you happy performance tuning!